.jpeg)
Da anni siamo ormai in un ambiente di tassi in caduta libera. Sia in Europa che negli Stati Uniti, le banche centrali hanno ripetutamente tagliato i tassi d’interesse nel tentativo di far ripartire l’economia.
In quest’articolo, discutiamo con Davide Buccheri degli effetti che queste politiche monetarie hanno avuto sulla valutazione dell’S&P 500.
“Come ho discusso in un altro pezzo, l’S&P 500 è attualmente ad un livello molto superiore a quello previsto dal PIL. Ritengo che una possibile spiegazione di questo scostamento possa essere legata agli effetti che queste politiche hanno avuto sui tassi di sconto” spiega Buccheri.
Trend nei tassi
Il grafico che segue mostra il trend dei tassi a 10 anni statunitensi, secondo i dati prodotti da FRED St. Louis.
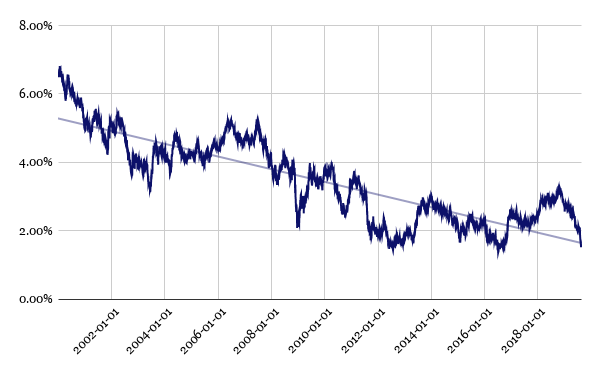
“I tassi sono stati in un continuo trend di discesa per gli ultimi 20 anni” nota Buccheri. “In particolare, i tassi a 10 anni sono scesi dal 6.58% all’1.55%, una discesa di circa 25bps all’anno”.
Modello di prezzo
A questo punto è necessario introdurre delle ipotesi.
Secondo la teoria finanziaria, il prezzo di uno strumento dovrebbe essere uguale al valore attuale dei suoi flussi di cassa futuri. “Siccome le azioni non hanno scadenza, possiamo trattarle come perpetuities” nota Buccheri. “Questa è un’utile approssimazione, in quanto la formula delle perpetuities è di facile trattabilità”.
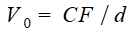
Dove CF è il flusso di cassa atteso e d è il fattore di sconto. Questo dovrebbe avere un aspetto simile all’equazione riportata sotto:
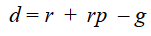
Abbiamo il nostro tasso a 10 anni, rappresentato da r, aumentato dal premio per il rischio, rp, and diminuito dal tasso di crescita di lungo termine g.
“Nonostante questa sia un’approssimazione alquanto grezza della realtà, questa formula è già assai difficile per un utilizzo pratico” nota Buccheri.Albeit a very rough approximation of reality, this formula is already quite problematic for practical use, as all of these variables are unknown. The only thing we know is the price of the market today. It'd be nice to be able to use a more precise model, but this would render an already difficult analysis almost impossible.
Next, we look at the price evolution of a security. Given the formula above, this can be expressed as:
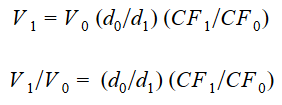
This is quite straightforward: if the expected cashflow doubles or the discount rate halves, the value of the instrument doubles, and vice versa. The beauty of this formula is that the price of a security can be expressed as a function of the growth of discount rates and cash flows through time alone. We don't necessarily need the inputs, but just their ratios. Armed with this formula, we can try to analyse the effect that the decrease in yields had on the S&P 500.
Estimating the impact of declining rates on the S&P 500
The immediate problem we face is that we don’t have any of the inputs needed for the formula. Therefore, we need to get there from the back door: we’ll compute the parameters for different importance levels of the change in rate and change in cashflow and we’ll then judge how reasonable the inputs we found this way are.
Initially, we will assume that risk premia did not change. Therefore, the only variable in the discount rate will be the Treasury yield. We’ll modify this assumption later.
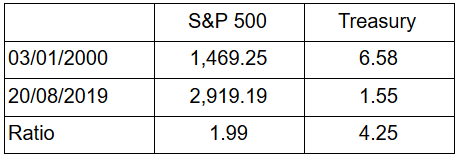
Looking at the data, we can see that the S&P 500 doubled, whereas the Treasury yield fell by 75%. This tells us that, theoretically, the fall in yields could explain 100% of the S&P 500 appreciation (4.25 > 1.99), depending on the size of risk premia.
With these assumptions, these are the estimated discount rates and risk premia:
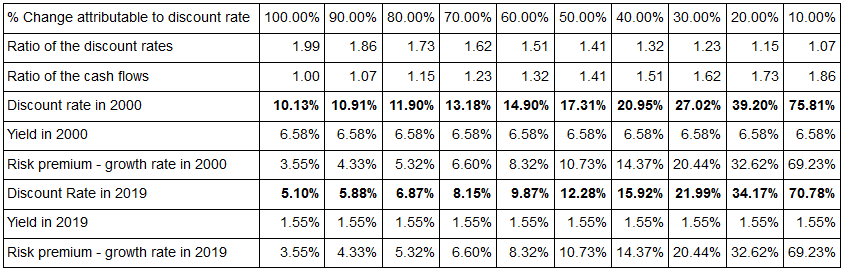
What we’re interested in is to understand whether these discount rates (in bold) are at all reasonable.
We can safely assume that risk premia above 20% are excessive. This leads us to a preliminary conclusion that at least 30% of the appreciation of the S&P 500 could be attributable to the change in yields alone.
However, this conclusion would be incomplete. In actual fact, a contraction in risk premia would also affect the estimated ratio of the discount rates. In order to take this into account, I then modelled the effect of risk premia shrinking by up to 5%.
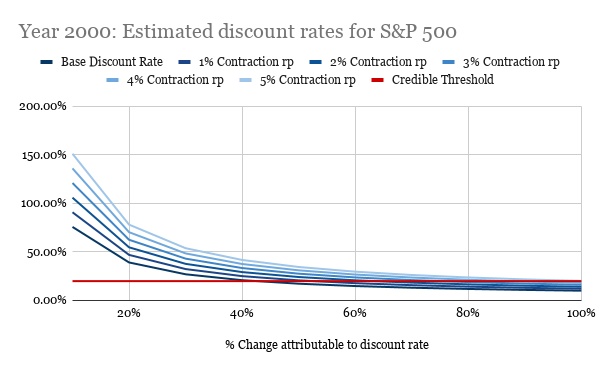
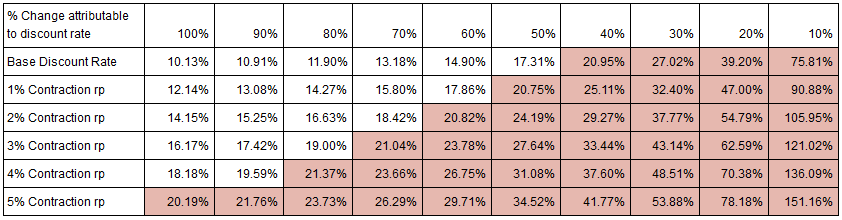
Assuming that discount rates above 20% are unrealistic, this chart tells us that, according to our model, at least 50% of the appreciation of the S&P 500 since 2000 can be linked to a decrease in the Treasury yield and risk premia in general.
If we then also assume that risk premia have contracted by at least 1%, at least 60% of the total change in the S&P 500 is attributable to rates alone.

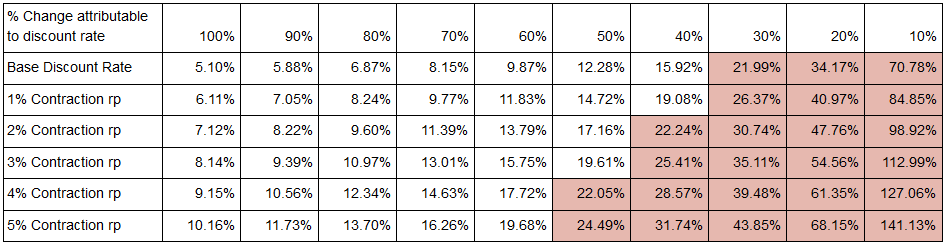
What is remarkable about this is that we aren’t able to exclude that all of the change in price in the S&P 500 is attributable to the change in rates only. In actual fact, this seems quite probable: if we assume a 2% of contraction in risk premia since 2000, we'd end up with reasonable rates of 14% (c.7.5% risk premium - growth rate) in 2000 and 7% (c.5.5% risk premium - growth rate) in 2019. As the assumed contribution of cash flows to the growth of the S&P 500 increases, so do the discount rates, reaching less reasonable levels.
Linking it all together
Having got this far, it's now time to compare these findings to what I had previously found regarding US GDP and the S&P 500. The results are frankly astounding.
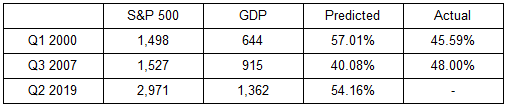
The table above shows that the S&P 500 is currently around 50% overpriced and should be at a level of around 1,400, according to the standardised GDP series. Interestingly, a 50% fall in the S&P 500 would bring it back to around the level it was at in the year 2000.
This seems to suggest that indeed, the appreciation of the S&P 500 in the past 20 years can be entirely attributed to falling interest rates. This could also indicates that expansionary monetary policies had the effect of detaching the S&P 500 from its long-term economic trend, bringing it to excessively high levels and indirectly provoking significant market corrections.

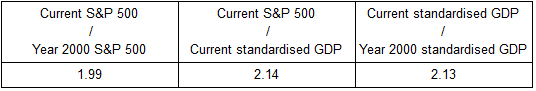
This idea is significantly supported by the chart above. We know as a fact that the stock market was overvalued at the beginning of the year 2000. In the period 2000 - 2019, the S&P 500 and GDP have grown at substantially the same rate (S&P is now 1.99x and GDP 2.13x, compared to 2000). This implies that the S&P 500 must be as overvalued today as it was back then, if we believe that the long-term growth rate of the two should be the same.
Conclusion
The analysis I conducted suggests that a significant proportion of the S&P 500 appreciation since 2000 can be attributed to rates movements alone. Combining this with the long-term GDP trend suggests that, probably, the entirety of the S&P 500 appreciation in the past two decades can be attributed to a decline in interest rates alone. It is debatable whether this is necessarily a net negative.
On one hand, one could argue that this is a true creation of wealth. After all, the increases in the price of stocks are a very real benefit for shareholders. This excess cash could then be deployed in new investments, which should generate additional cash flows. This should cause an acceleration of the GDP growth rate, which we are however yet to see.
On the other hand, no new cash flows are being generated immediately and the uptrend is possible only for as long as rates have space to decline. This cannot go on forever (notwithstanding a staunch attempt to prove otherwise by the EU). In addition, the divergence of the S&P 500 growth rate and the GDP growth rate can only be temporary. So far, GDP is giving no signs of catching up, which implies that a significant market correction might occur, bringing the two in line.
From a macroeconomic perspective, these findings seem to suggest that the significant market corrections we experienced in 2000 and 2008 could be direct consequences of excessively aggressive expansionary monetary policies, which caused an inflation of the valuation of securities, without a corresponding kick to the real economy.